The Tanda Marathon Pace Predictor website, based on research by Giovanno Tanda has recently been updated and refreshed. It is a really useful tool to build a training plan that will help achieve a target marathon performance.
Another related tool, developed by the innovator behind KuduSmart, Dr Christof Schwiening, is the CRplots training analysis web site which provides detailed insights into personal training data pulled from individual Strava activity feeds.
Enjoy!
What is the reasoning for measuring and recording sweat rate? Ultimately, there are several answers to this question, all of which are valid. There’s a strong case to be made for simply saying “more data is better”, and therefore if we can record any physiological metric we should. The argument here says that when more metrics are measured, a coach can form a clearer picture of how an athlete responds to a training load. Measuring and recording a wide variety of metrics means that a coach can use historical data to predict current performance.
Let’s imagine a professional cycling team. When selecting the squad for a race the coaches will draw upon a huge pool of data to help make the best selection. For example Cyclist A might have had the best performance in a recent race but because the amount & quality of their sleep is being tracked the coaches know that this athlete isn’t fully recovered so many not be the best choice for the next race. Or Cyclist B might usually not have made the team but because their haematocrit is particularly high the coaches know Cyclist B is a good choice for a given race. In my opinion tracking as many metrics as possible is a good mantra to follow, however, for the non-professional athlete, with limited resources, it is just not practical to track everything.
Another reason sweat rate is a useful metric to measure is that is a fundamental metric, and one which can be trained. Whenever a human performs exercise they have to burn fuel to create movement. The burning of fuel is not an efficient process, with around 80% of the energy that was stored in the fuel appearing as heat rather than being used to perform the exercise. Because human physiology is dependent on the core body temperature being kept within a relatively tight range, this heat has to leave the body. In the exercising human most of this heat is lost via the evaporation of sweat. Just like most other physiological processes the sweat response can be trained, with the individual sweat glands becoming bigger and more efficient with training. Ultimately, what this means for an athlete is that an under-trained sweat response may be a limiting factor during exercise. Since it is important to track any metric that may be a limiting factor during competition, this explanation shows that sweat rate is a metric that is a metric that worth tracking.
| For further insight into the rational for measuring sweat rate, and how sweating effects the exercising human, download and print the KuduSmart white paper: | |
|
April 22nd saw 40,000 runners hit the streets on London for (in my opinion) the greatest marathon in the world. This year was particularly noteworthy as it was the hottest on record. It’s the 3rd year in a row I’ve run in London, but each year has been very different. This year the heat was all anyone was talking about. When the high humidity and lack of clouds are taken into account it resulted in a roughly 3.5% - 5% performance decrement for the runners. Part of the reason it proved such an issue for many of the runners was because the weeks leading up to the race were cold, and then it suddenly got hot in the few days beforehand. This means that most runners were not acclimated to running in the heat, and the slow finishing time reflected this.
Credit to the organisers, they had increased the number of water stations on the route and this went a long way to keeping the runners cool enough. While we’re on the subject of the organisers it’s worth mentioning they are a key reason that I consider London to be the best race around. The whole London experience is smooth and well organised; free public transport for runners on race day, an efficient starting system and flawless bag collection at the end all contribute to a fantastic race day experience.
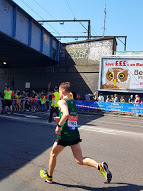
I was thankful for every little bit of shade
For me the race was a success, but not surprising. The combination of tracking all my training and having done 12 marathons over the last 5 years means I was confident of the time I could run and was able to formulate a race plan appropriate for the conditions. And, although I did slow down a little in the last 8km I put this down to a “motivational bonk” upon realising I would not break the 2:30 mark. If you’re really keen to know what was going through my head during the race I’ve provided a mile-by-mile analysis of my race below*.
At the end of it all a finishing time of 2:32:50 was a good pb and 46th place (excluding the elite runners) meant I was able to cross the line, recover, get changed and be looking fresh before any of my friends showed up in the finishing area. In reality it doesn’t matter what speed you run, the important thing is making it look easy.
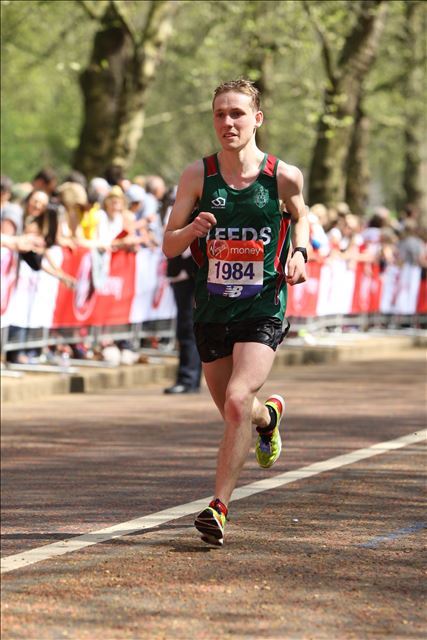
Ok so "making it look easy" might have been an exaggeration
*here’s how it happened: On the start line I made sure to have a bottle of water that I was consistently pouring over myself. It was important to start the race as cool as possible. I made sure not to do anything as silly as “warm up”. Miles 1-3 were a too slow. I always race according to my heart rate, without my watch even showing me what pace I’m running. Unfortunately the heat meant my HR was higher than expected so it was only towards the end of mile 3 when I decided that I could push the HR by an extra 3bpm. Mile 4 was pretty dull, I just made sure to keep my HR at 170bpm. Mile 5 was enjoyable because I saw a friend in the crowd cheering me on. Thanks Catrin! The same happened at mile 6 with my family – thanks to you guys too. It was then a fairly consistent trot up to Tower Bridge, the halfway mark. This is probably my favourite part of the race. The volume of the support is truly astounding.
At halfway I saw that I was roughly 50 seconds slower than 2:30 pace. Still feeling good I decided to up the pace a little to see if I could regain this time and go sub-2:30. Miles 13-20 were a steady gain on the time I had lost in the first 3 miles. To my surprise I was able to keep a consistent HR during this effort. I expected it to rise by around 1bpm per km. However, I stayed at a steady 171bpm. By mile 20 the number of people in front of me had reduced to around 50. This meant that I did not have runners in front of me to draft off. Up until this point I had a significant aerodynamic advantage because I was moving up through the pack. For the last 6 miles I was essentially alone, which provides both an aerodynamic and motivational challenge. It was around mile 21 when I realised I would not be able to go sub-2:30 so I opted for easing off the effort, down to 169bpm. This meant a slight reduction in pace for the last 5 miles, but I decided it was better to slow down and enjoy the last few miles rather than put everything in an risk a serious explosion.
At every water station I took a bottle of water to pour over myself to assist cooling. As usual (for me) I didn’t eat or drink anything during the race and made sure I ran as close to the blue line as possible, although I did deviate from the shortest course if I decided it was better to draft off another runner or run in the shade. Overall it was pleasing because I a) executed my plan fairly well, and b) produced a good result from the training that lead up to London.